 QA Report
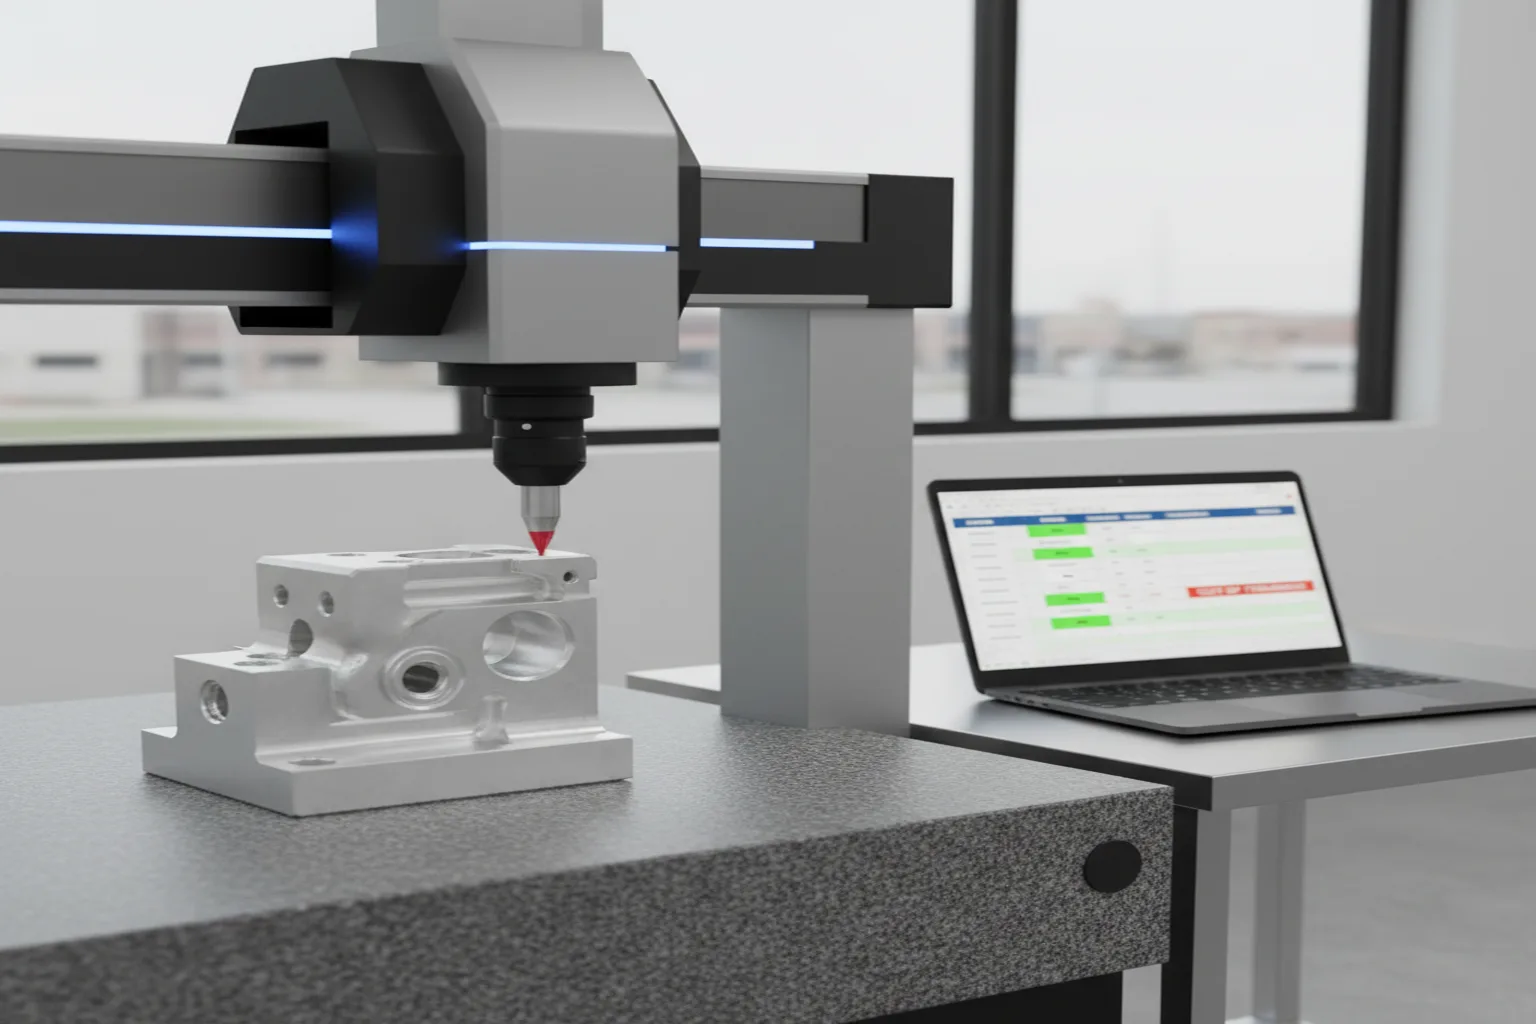

Your CMM already measured all 60 dimensions in ninety seconds. Then someone spends the next hour retyping those numbers into a spreadsheet, checking each one against the drawing by eye. The measurement was automated. The report was not.
That gap is where most inspection time and most inspection errors live. Learning to import CMM data directly into your report closes it: the measured values land in the report already mapped to the drawing, already compared to tolerance, already flagged where they fail. This guide walks through what "CMM data import" actually means, how the mapping works, and how the same imported data feeds a full AS9102 first article inspection report.
A coordinate measuring machine outputs a results file: a list of characteristics with nominal values, measured values, and deviations. On most shop floors that file gets read on one screen while a person types the numbers into a report template on another. It feels like five minutes. Across a full first article, with 40 to 120 characteristics, it is not.
Manual transcription costs you three things at once:
Importing CMM data means taking the results file your measurement software already produces and loading it straight into the inspection report, instead of retyping it. The measured value for each characteristic is read from the file and dropped into the matching row of the report. No second data-entry pass.
The results file usually comes out of the CMM software you already run - Mitutoyo MCOSMOS, and other common CMM and gauge outputs. Because a good import is configurable rather than tied to one machine, a mixed shop floor can standardize on a single reporting workflow even when the measuring hardware varies from cell to cell.
The point is not just speed. When the report reads the measured values instead of a person copying them, the numbers in the report are guaranteed to match the numbers the machine actually recorded.
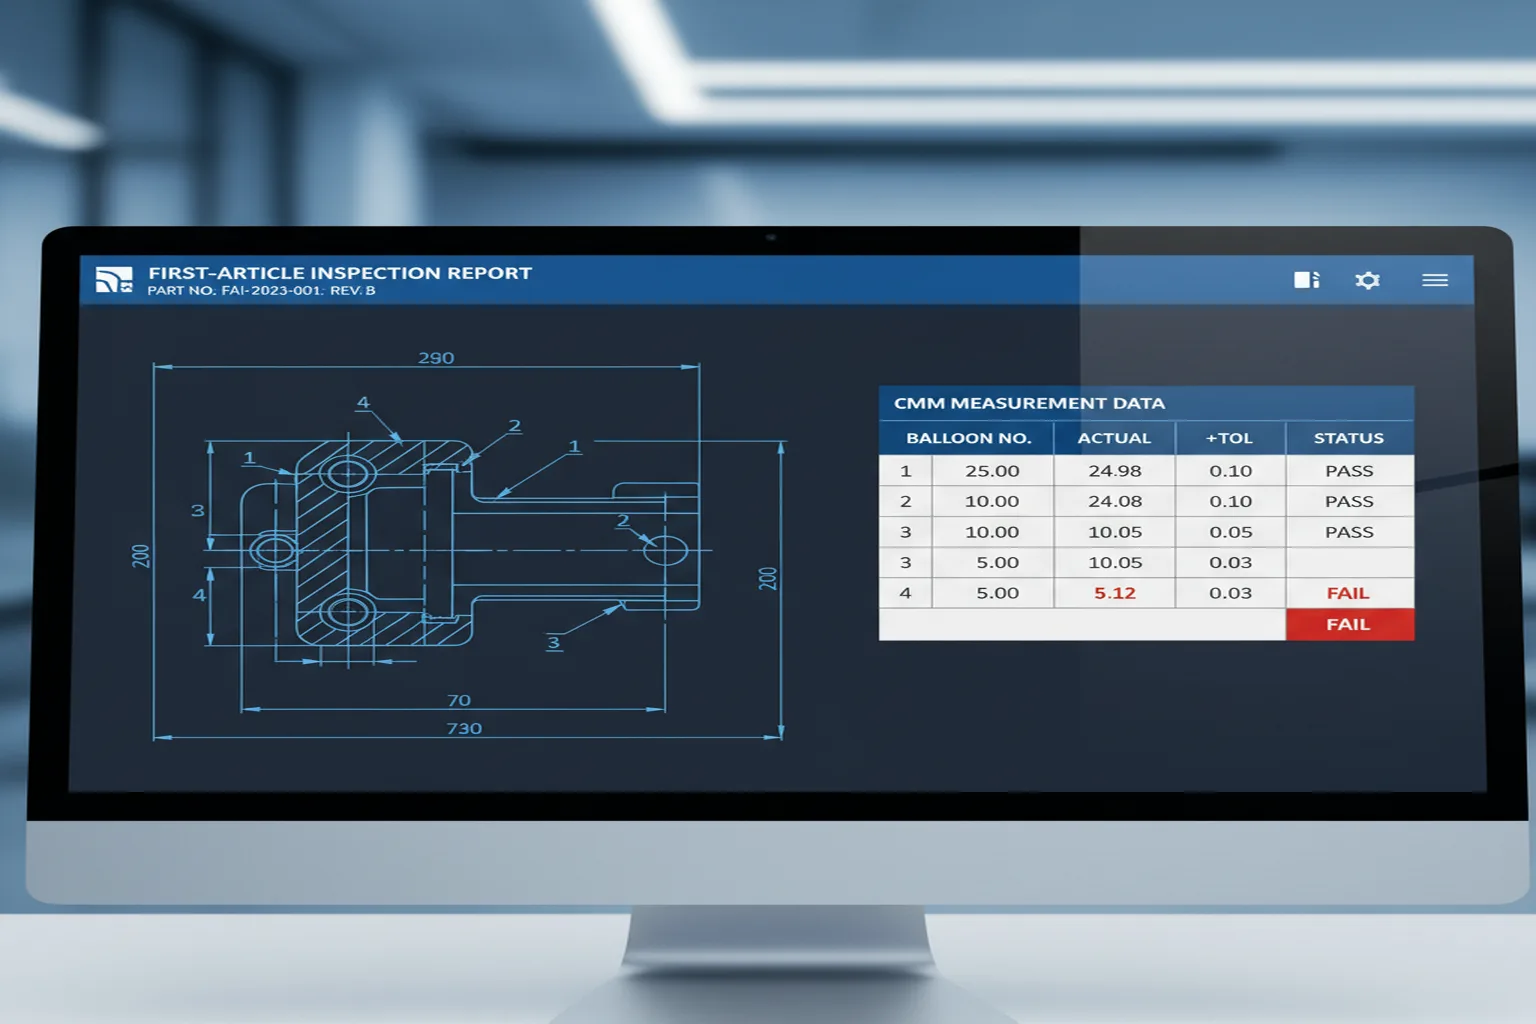
A report is only useful if each measured value lands next to the right requirement. That link is the balloon number. When you balloon a drawing, every dimension gets a unique number; the report lists those same numbers with their nominal and tolerance. Importing CMM data means matching each measured result to its balloon so the value appears on the correct line.
Do the ballooning once, up front, and the mapping holds for every part in the run and every subsequent lot. If you have not ballooned the drawing yet, that is the natural first step - and you can do it by hand in a browser before you ever import a single measurement (see the free tool below).
Once a measured value is mapped to its characteristic, the report already knows the nominal and the tolerance band. So the moment the data is imported, every value can be compared to its limits automatically. In-tolerance results pass; anything outside its band is flagged the instant it lands, not after a manual review.
This matters most for geometric callouts. Full GD&T support means position, profile, runout and the rest are evaluated against their feature control frames, including datum references - the checks most likely to be missed when a tired inspector is comparing a printout to a drawing at the end of a shift.
The same imported data does double duty. A dimensional results table is what a CMM report shows; a first article inspection report (FAIR) wraps those results in the standardized structure aerospace and automotive customers require - AS9102 Forms 1 to 3 for aerospace, or the dimensional-results portion of a PPAP submission for automotive.
Because the measured values already carry their balloon numbers and pass or fail status, generating the FAIR is a matter of formatting, not re-measuring or re-typing. Part and material accountability, characteristic-by-characteristic verification, and the raw measurement files stay bundled with the report, so the whole package is ready for an ISO 9001 or AS9100 audit at any time.
| Step | Manual entry | Imported CMM data |
|---|---|---|
| Getting values into the report | Retype every result by hand | Read straight from the CMM file |
| Matching values to the drawing | Find the row by eye each time | Mapped to balloon numbers |
| Tolerance checking | Compare each value manually | Flagged automatically on import |
| Transcription errors | One typo can pass a bad part | No re-typing, no typos |
| Audit traceability | Hand-copied summary | Report tied to raw machine output |
If your CMM can measure a part in under two minutes, why should documenting it take an hour?
Your CMM already produces the numbers. Importing that data - instead of retyping it - turns the results file into a mapped, tolerance-checked, audit-ready report in a fraction of the time, and removes the transcription errors that manual entry invites. Balloon the drawing once, import the measurements, and let the report do the checking.
Use our free online ballooning tool to manually number every dimension on your engineering drawing. No login, no email, no credit card. Export a ballooned PDF in seconds.
Try the Free Ballooning ToolWatch how QA Report imports CMM measurement data, maps it to ballooned dimensions, and generates audit-ready inspection reports.
Watch Demo Videos